Best Charts For Baja

MYNomad

Furuno Fan
I would like to get the best charts available for Baja California. From Furuno's website, it appears that there are two choices: MM3-91-2GO, which is a raster chart, and MM3-VNA-024, which is a C-Map by Jeppeson vector chart. (The same charts of Baha are available in different coverage areas, but all have the same cartography.)

No Furuno dealer I have talked to can show me a side by side comparison of the two charts (I would like to see how each displays Ensenada, since I am most familiar with that area), so choosing is like buying a pig in a poke. There must be a better way. If not, does anyone have any advice?
 
Do you have the current charts? I'm getting ready to do a chart update, I can take pics of them and post them if it would help.
Dave
 
Dave,
Thank you. I do have the most current charts that Furuno provides without charge. The detail, resolution and accuracy are poor (especially as compared to Furuno's US charts, also free). After I order something, I will try to post a couple of side by side pictures to help the next guy.
-Rick
 
Rick,
Are you talking about Northern Mexico area? Any charts covering that area would be a paid/licensed chart. Anything you might see that is "free" is just a basic outline/base chart and should never be used for navigation. If you can verify the area in question; I will post you some screen shots. Raster charts (scanned paper charts) normally won’t look as good as vector, plus vector charts take less room in the machine and have interactive content. Without even comparing the two; I would recommend the vector.
 
I am talking about norther Mexico, pacific side. I should have been clearer -- I am looking for the best paid chart I can get of northern Mexico, pacific side (and did not mean to sound like I was dissatisfied with Furuno's free Mexico charts -- I get that anything better has to be licensed, unlike US charts that are produced by NOAA and made available free of charge).

The choices I see on Furuno's website are MM3-R91-2GO and MM3-VNA-024. I would appreciate seeing screen shots of those two, expecially if they can show Ensenada (the harbor at approx 31 52N, 116 40 W).

Thanks,
Rick
 
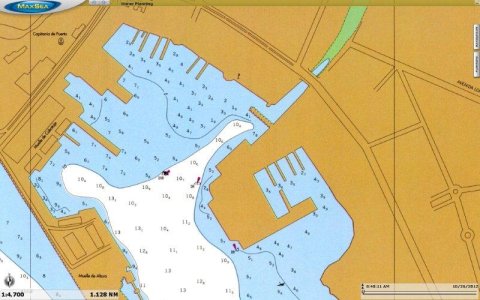
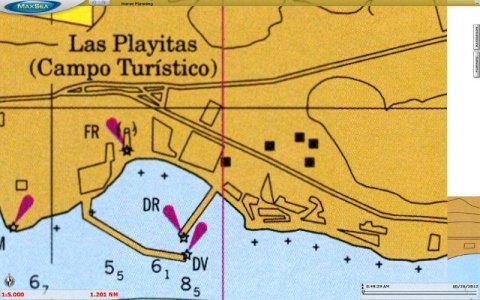
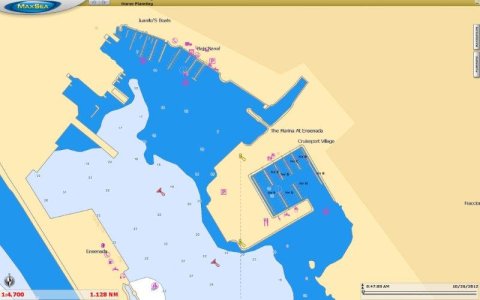
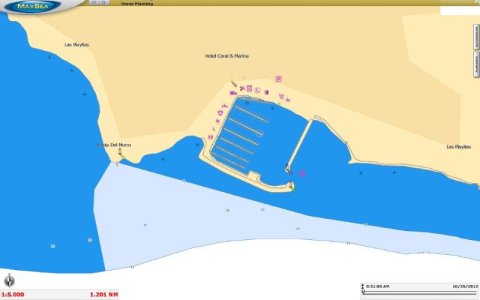
The captures might not look the best after reducing them for web posting, but it should give you some idea. Raster on the LEFT and Vector on the RIGHT. They are not exactly to the same scale; but close.
combo1.jpg
Combo2.jpg
combo3.jpg
 
Thank you, Mr. Electron! This is very helpful, although it is hard to discern any difference in detail. The top left hand side of the right picture in the second pair of pictures shows a marina (not the main Ensenada harbor). That marina can also be seen in the left had side picture in the first pair of pictures, but since it is not zoomed in as much, it is hard to compare. Also, I have notice that some charts the resolution improves when you zoom in. Would it be possible to zoom in so that marina pretty much fills the screen and take a pic of that, as well as the same marina at about the same zoom level from the raster -- that will really help me choose the right package. Thank you for your help.
-Rick
 
I am sorry to persist, but are you sure the zoomed-in shots are of the same areas as the zoomed out? The detail is totally different. It looks like the bottom picture in each set is of the marina I mentioned, but the top pic in each set is of somewhere else entirely. Either than or its way off. If it isn't too much trouble, could you double check that please? It would be very helpful to me to see how much detail is available for that marina. Also, I note that the sat photos that come with the vector chart package are described as "standard resolution", while the sat photos that come with the raster charts are simply described as sat photos without reference to their resolution. If I am not wearing out my welcome, it would be great to see a side by side comparison of the sat photos for this area (at max resolution). Is it as good as Google Earth?
Thank you for your patience. -Rick
 
The top Raster is the same area as the top Vector.
The bottom Raster is the same area as bottom raster. (Another marine just north up the coast) Zooming in more, for both areas has the same data but just closer. If you right click on the graphic and select " Open in a new window" you will get a slightly larger photo to look at. The SAT photo is the same for both packages. The Sat photo is at lower res that what we have for the USA; is pretty ugly at those close in ranges. It is only worth using at the upper ranges like previously shown.
 
Any chance you could post screen shots of the raster and vector versions of the marina shown in the bottom picture (that is the one I am familiar with, and I would like to see if either shows those obstructions. That would be the one I would purchase.

As to Sat Photos, is there any source for google-earth quality images? I note that the sat photos of US areas are of comparable quality. Is the Sat Photo quality better with Max Sea, or is it possible to load up Google-earth or other imagery for max sea that can't be loaded up on NN3D?
Thank you for your help.
 
I am not sure exactly what you are wanting. A closer range screen shot of that marina? There isn't any more detail closer in for that area/chart for either the raster or the vector. It would be just like you opening the photo I provided and bring it closer to your face, except maybe a bit clearer.

No, you can't load your own SAT photos from Google. They have to be in the correct file format for the system to use it. (Photo Fusion) Right now, for that area... It is what it is, for the SAT Photo. The data provided by C-map is based on the official raster charts for the host country. Some areas are better than others but it is basically the same data you would get on a C-map Max chip on a Vx2 but without SAT overlay.
 
Sometimes, at least with raster charts, when I zoom in on my NN3D, a lot of new detail appears. (I think that is because it is showing a scan of detail that isn't shown on the main chart, but is on select areas.) I don't use vector charts, so I don't really know if they show more detail at higher zoom levels, but I was hoping so. So my hope was to see the zoomed-in versions of both raster and vector of the harbor shown on the bottom picture of your post at Oct 26, 2012 5:58 am. But, if there is no more detail to be shown, I understand.

As for Sat photos, is there a way for me to convert to the correct format using Photo Fusion?
If not, can you tell me whether the satellite resolution is the same in both the raster package and the vector package? I am hoping not, since one is described as "standard" resolution and the other is not.

Thank you.
-Rick
 
There is no way to convert your own SAT photos into MM3 file format for Photo Fusion. Mapmedia is always working on improving the existing data with commercially available data that is cost effective to the customer.

I am not showing any SAT resolution difference between the two offered packages (Raster or Vector) for that area. Unless otherwise stated; Sat photo are at standard resolution. If they are High Res, they will be stated as such.

There is no better detail, zoomed in closer, for that area. If there was; I would show you.
 
Back
Top