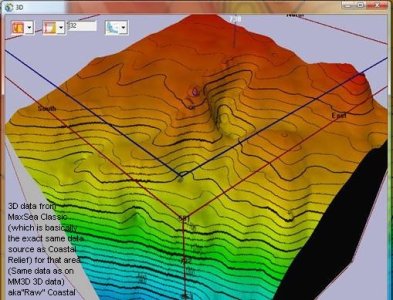
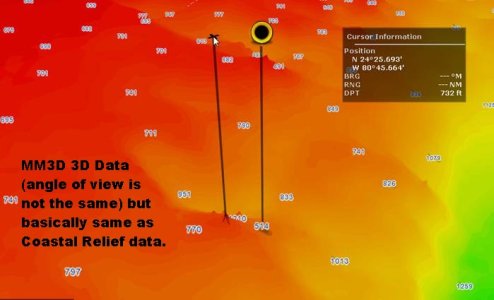
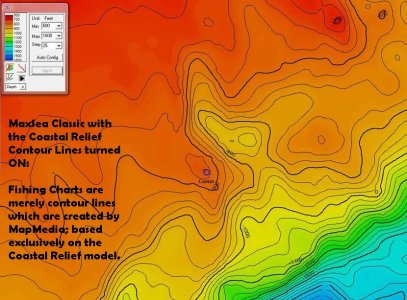
Talking with MaxSea; the data in that area is debatable. Maybe you can provide some screen shots and lat/lons to our normal support folks (
http://www.FurunoUSA.com – SUPPORT – ASK FURUNO A QUESTION) next time you are in that area. Here is the supporting data from MaxSea.
Here is a little bit of explanation where the MM3D 3D data (used for Depth Shading) is coming from.
Near shore, the 3D data is extracted from the vector charts (S57 charts). In shallow water it is MUCH better to use the 3D from the vector charts because it is the most up to date and usually you have enough depth soundings and contour lines on the S57 charts to create a nice 3D database.
However, in deeper water, the density of the Vector charts soundings decreased rapidly (because over 100ft of water are not areas that are a threat to navigation, so the depth information on the chart is very sparse). So, in deeper water, we rely on another 3D source (the "Coastal Relief 3D database" from NOAA). The Coastal Relief is a huge database that combines various surveys. You can read more about it there:
http://www.ngdc.noaa.gov/mgg/coastal/crm.html
In theory, this database offers much more accuracy especially in deeper water.


So really you have both data methods in your machine. Based on what they are saying, the fishing and 3D depth shading is most likely the better of the two in the deep waters. Look at the data it looks like that hump is more of a peak off of an underwater ledge. MaxSea said they are ready to consider any factual data you can provide them. We would gladly pass any information you can collect. (
http://www.FurunoUSA.com – SUPPORT – ASK FURUNO A QUESTION)