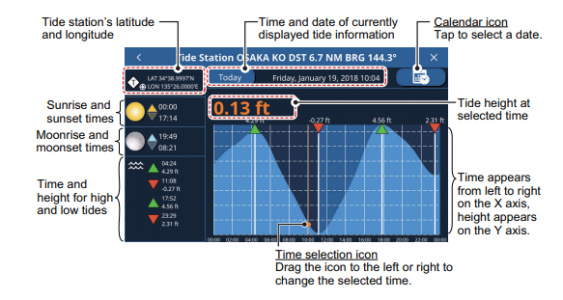
This may be too much to ask, but I notice that my TZ iBoat app displays tide info as a nice small graph in the left-side data box of the chart plotter screen. Is it possible to get a GP1971f to display tide this way, too? I see the ‘graph’ or ‘text’ options, but haven’t really fiddled with it. Would also be cool if it would graph depth as a line in addition to the text number.
I’m guessing no, but if these are possible, please advise. Thanks!
-c3
I’m guessing no, but if these are possible, please advise. Thanks!
-c3


